
Venn diagrams are a popular tool used in mathematics, logic, and statistics. These diagrams were first introduced by John Venn, a British logician and philosopher, in 1880. Venn diagrams are useful in organizing data and visualizing relationships between different sets.
What is a Venn Diagram?
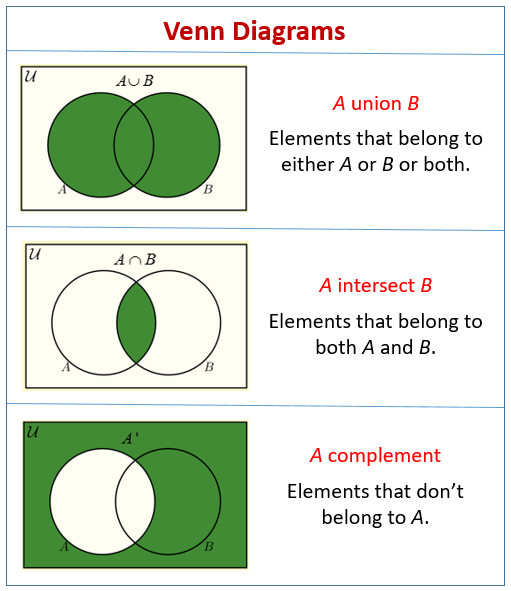
A Venn diagram is a graphical representation of a set or collection of objects. It consists of overlapping circles or ellipses that represent different sets or categories. Each circle or ellipse represents a set, and the overlap between circles or ellipses shows the relationship between those sets.
Uses of Venn Diagrams
Venn diagrams are used to organize data and visualize relationships between different sets. They are commonly used in mathematics, logic, and statistics to illustrate the concepts of set theory, probability, and Boolean algebra.
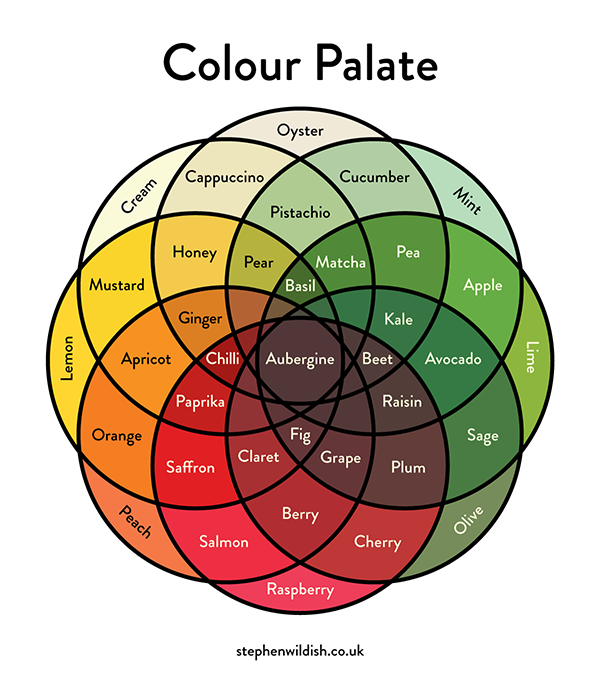
In addition to their use in mathematics and statistics, Venn diagrams are also used in many other fields. For example, they are used in business and marketing to analyze customer data and to identify trends and patterns. They are also used in biology to classify organisms and to study relationships between different species.
How to Create a Venn Diagram
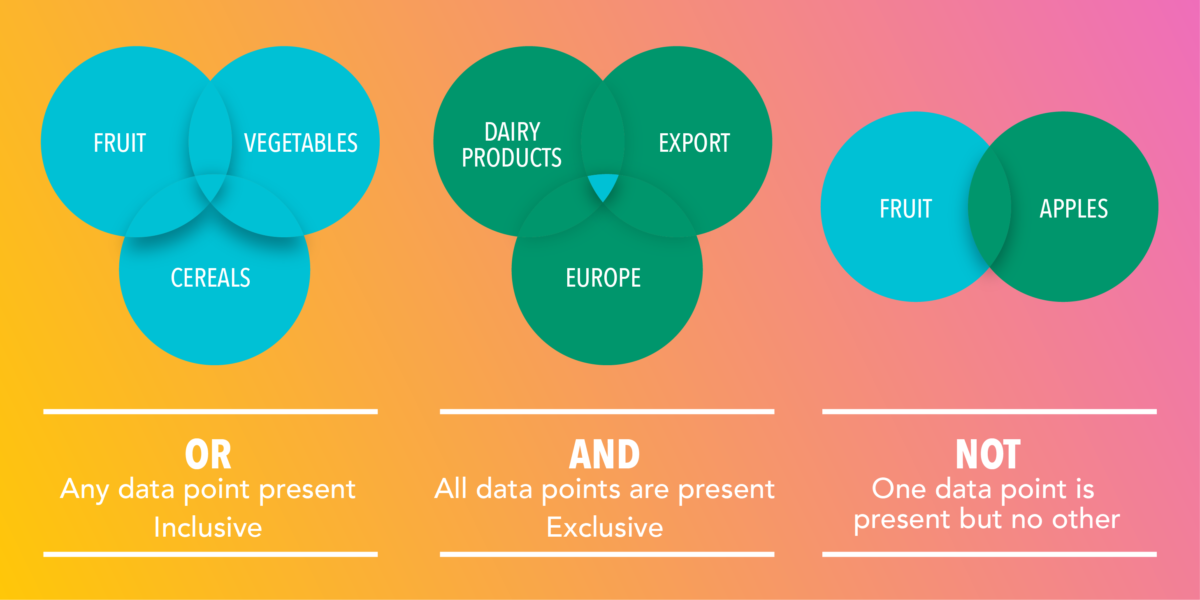
To create a Venn diagram, start by drawing two or more circles or ellipses that overlap each other. Label each circle or ellipse with the name of the set or category it represents. Then, shade or color in the areas of overlap to show the relationship between the sets.
When creating a Venn diagram, it is important to ensure that the circles or ellipses are properly positioned and sized to accurately represent the sets and their relationships. It is also important to choose appropriate labels and colors to make the diagram clear and easy to understand.
Advantages and Disadvantages of Venn Diagrams
One of the advantages of Venn diagrams is that they are easy to understand and interpret. They provide a visual representation of complex data that can be easily understood by people with different levels of mathematical and statistical knowledge.
However, Venn diagrams also have some limitations. They can only represent a limited number of sets or categories, and they may not be suitable for representing more complex relationships between sets. In addition, the interpretation of Venn diagrams can be subjective, and different people may interpret the same diagram in different ways.
Conclusion
Venn diagrams are a useful tool for organizing data and visualizing relationships between different sets. They are commonly used in mathematics, logic, and statistics, as well as in other fields such as business, marketing, and biology. While Venn diagrams have some limitations, they are a valuable tool for communicating complex information in a clear and concise manner.